Contribute
 Table of Contents
- To Developers
- To Users
🟠 Skill Level: INTERMEDIATE
 To Developers
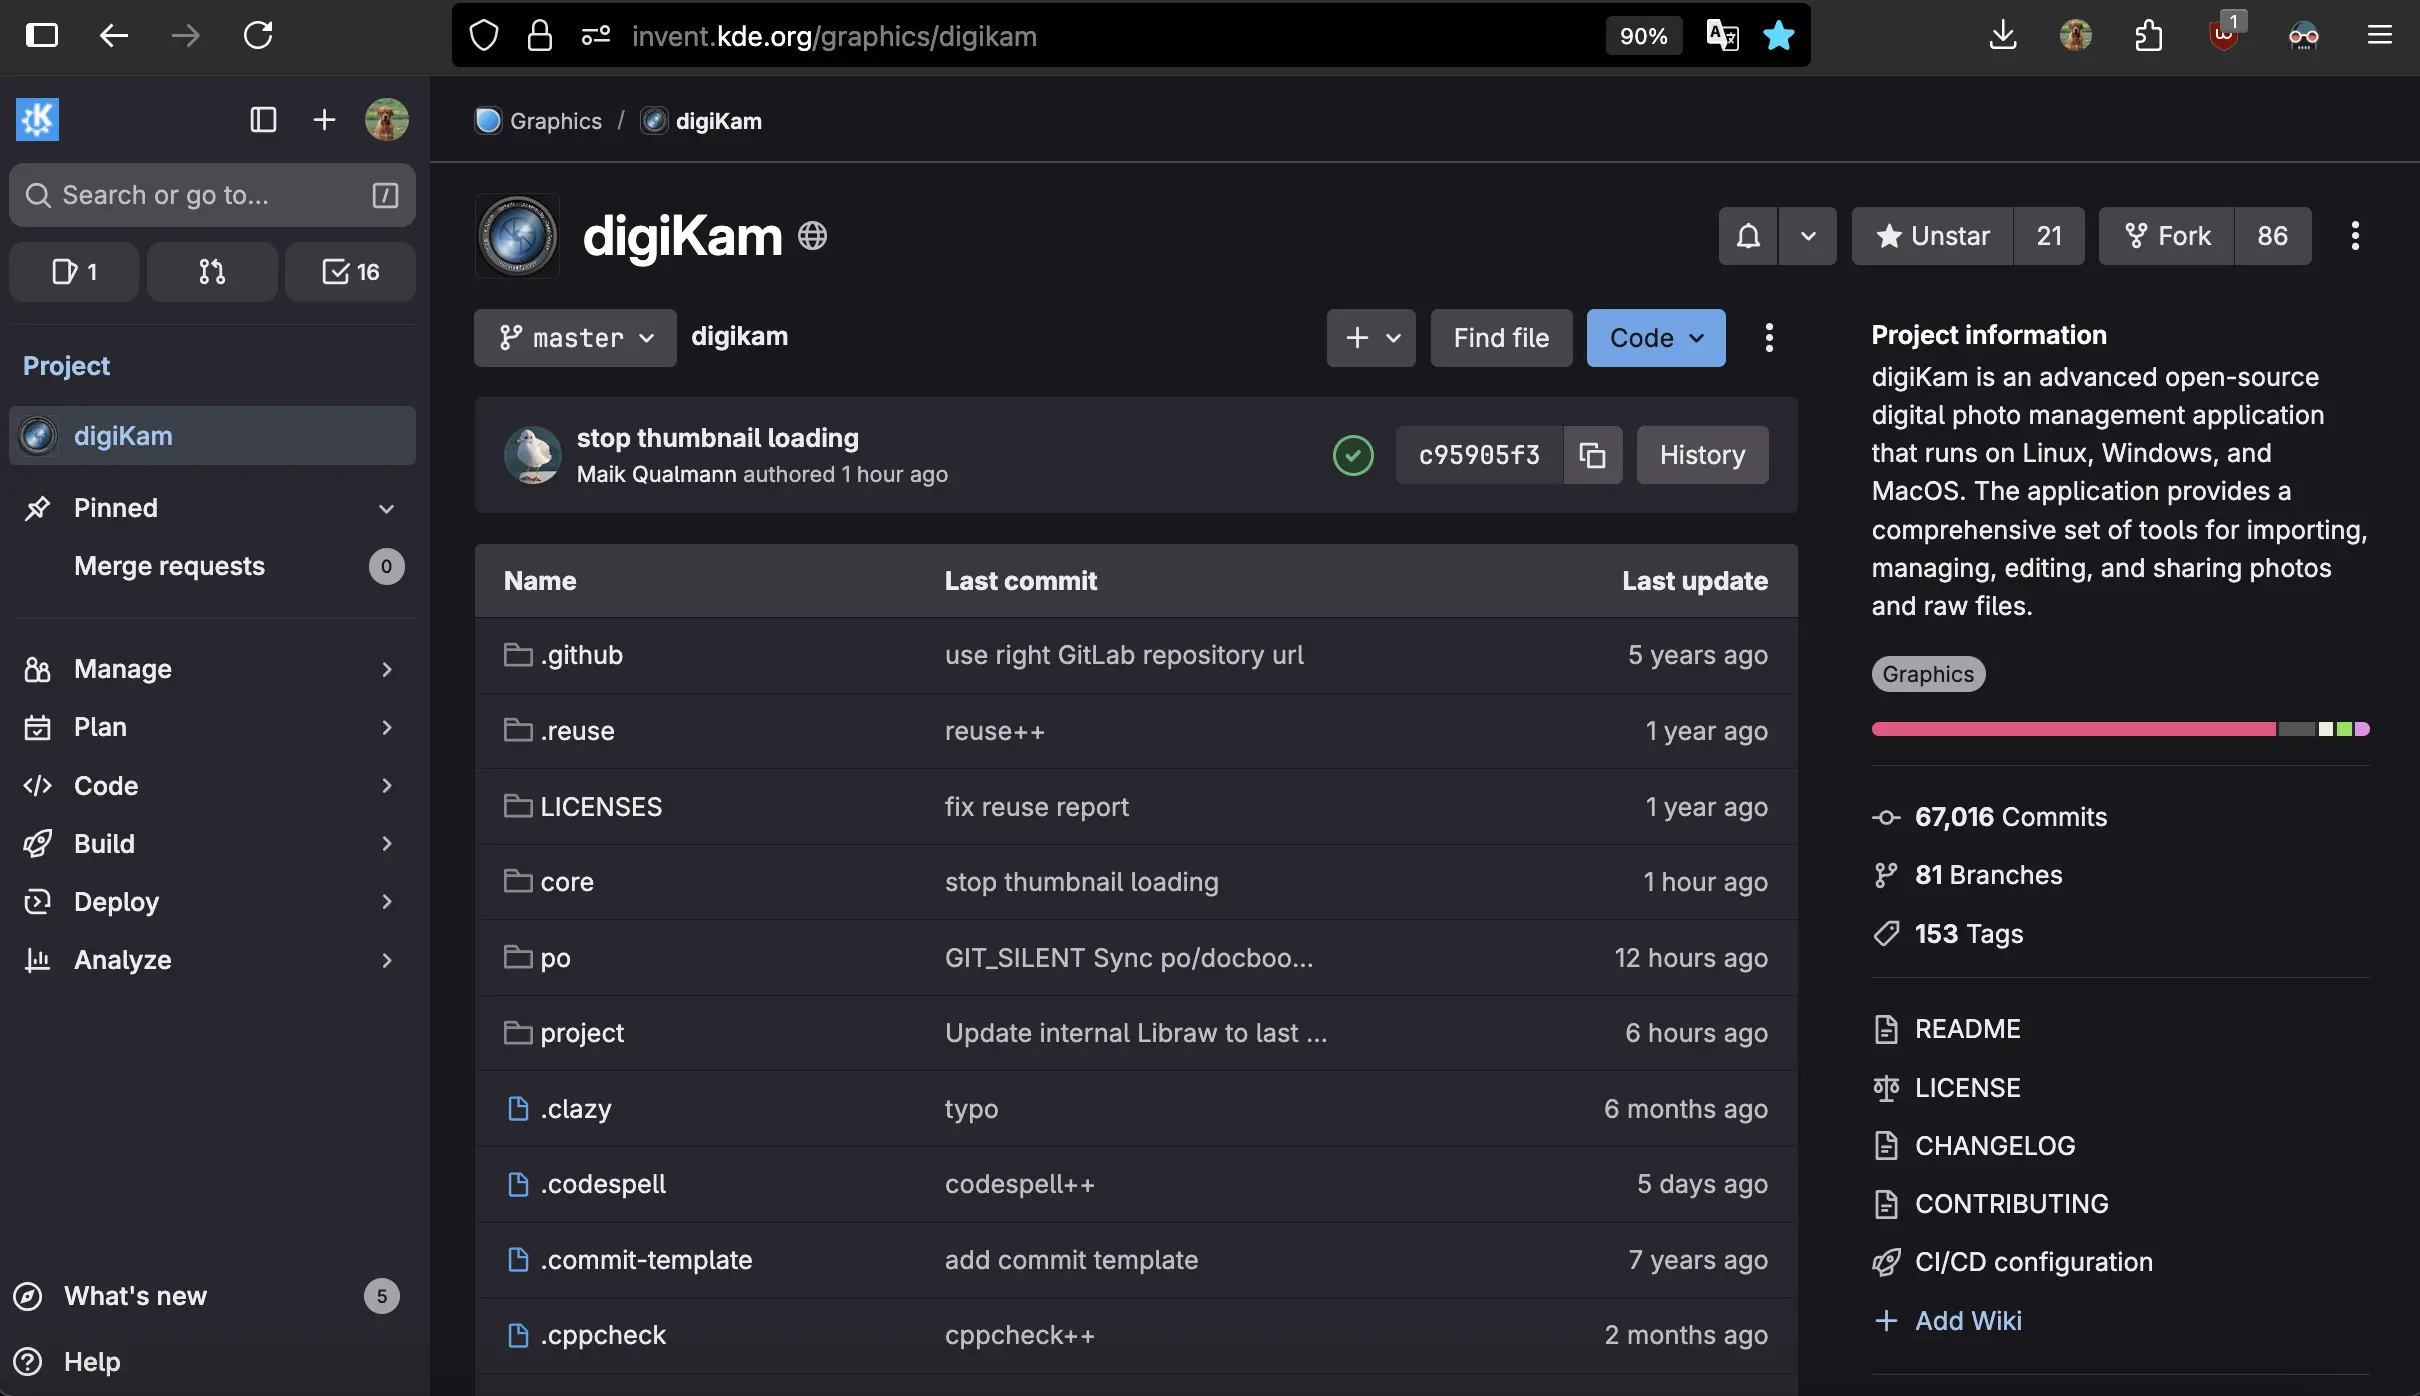
 GIT Repository
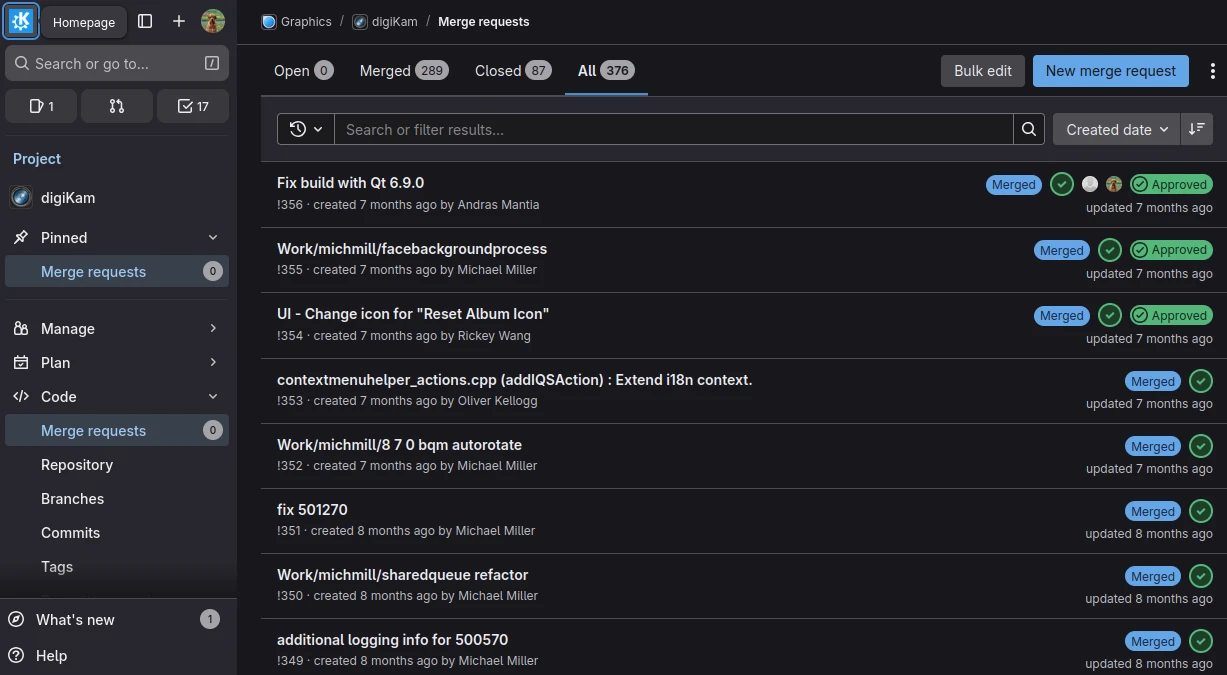
Access the digiKam source code repository via the GIT page on the GitLab/KDE-Invent infrastructure.
 Submitting Patches
Patches must be based on the latest git/master revision (not a stable release or old beta version).
- Preferred Method: Create a Merge Request (MR) on GitLab/KDE-Invent using a fork of the project. Online discussions with developers are supported.
- Alternative Method: Generate a patch file and attach it to a Bugzilla entry:
git diff HEAD > mydiff.patch
Note: Avoid using mailing lists or private emails for patch submissions.
 Checking for Memory Leaks
To detect memory leaks in digiKam on Linux, use Valgrind:
valgrind --tool=memcheck --leak-check=full --error-limit=no digikam
Report the output to the developers.
 To Users
The easiest way to contribute is to spread the word about digiKam. You can also:
- Test digiKam and report bugs.
- Submit feature requests.
- Join the r/digikam Subreddit Community Group or the digikam-users Mailing List to help other users.
 Reporting Bugs and Submitting Feature Requests
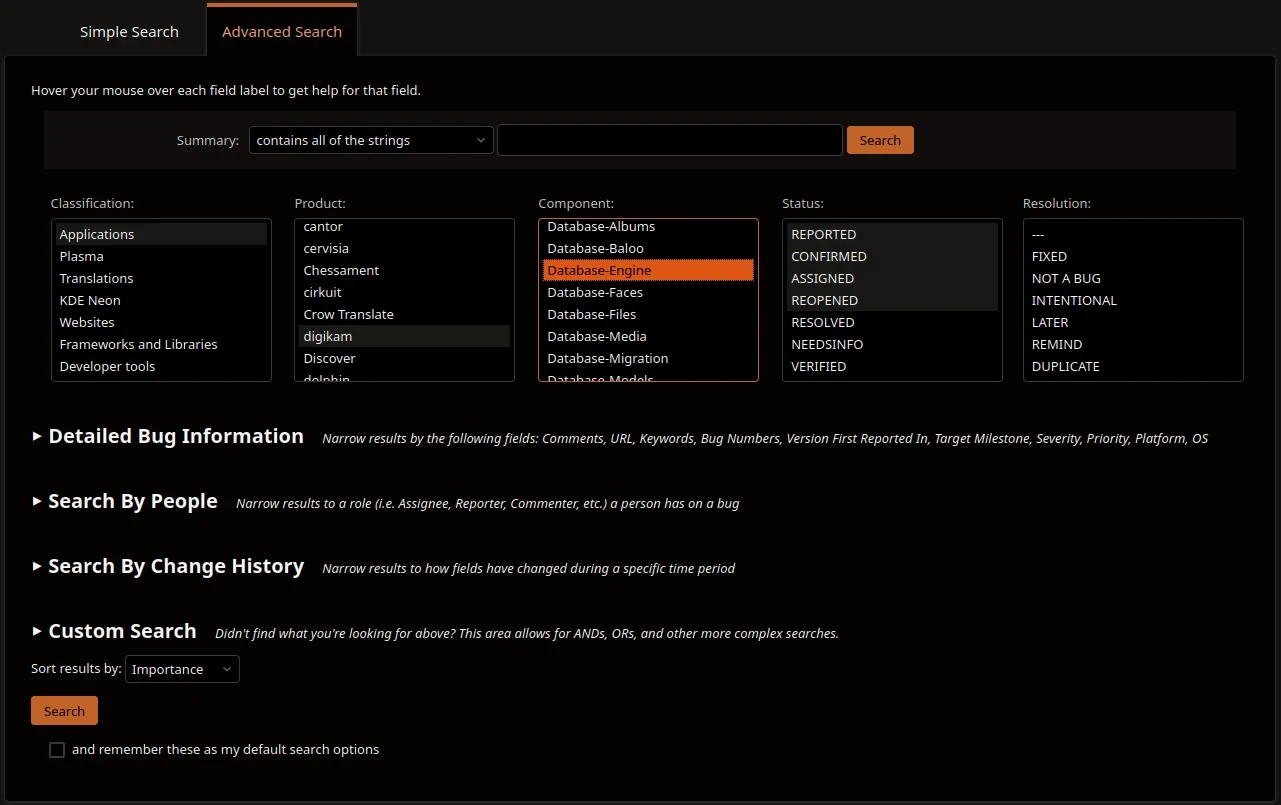
- Before to reporting a new entry, use the bug tracking search engine for all existing bug reports and feature requests.
- If no entry already exists about your topic, create a new one in the bug tracking system.
 Freezes and Other Run-Time Issues
 Linux Host
Run digiKam from the terminal to capture debug traces. Enable debug logging first:
export QT_LOGGING_RULES="digikam*=true"
digikam
 Windows Host
Windows does not output application logs to the terminal. Use DebugView to capture logs.
 If digiKam starts
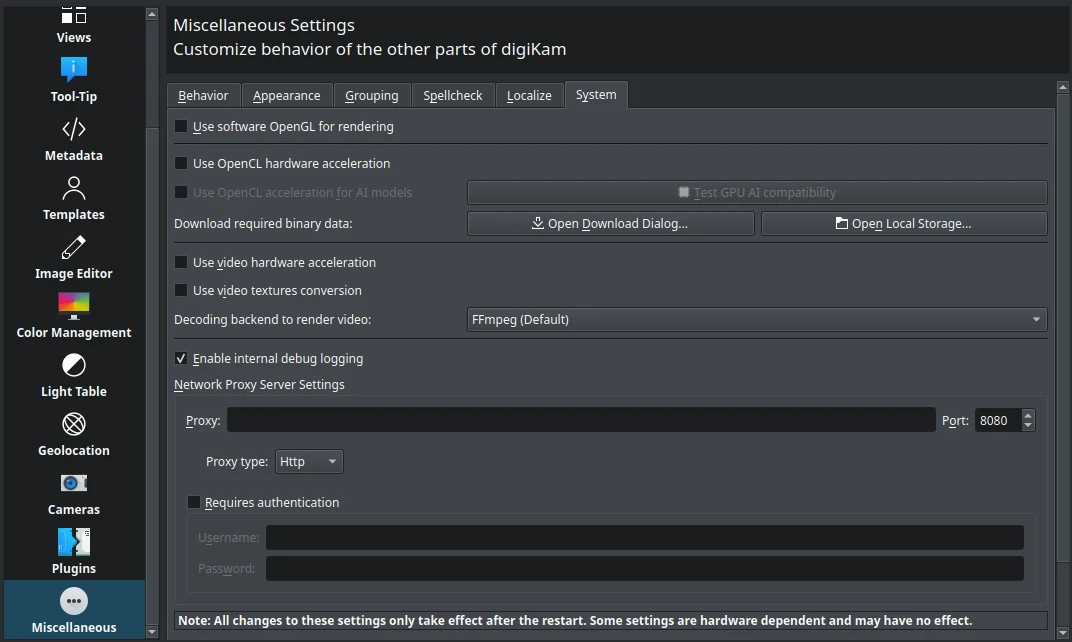
- Go to Settings → Configure digiKam → Miscellaneous → System.
- Enable Internal debug logging.
 If digiKam does not start
- Open System Properties → Environment Variables.
- Add a new user variable:
- Name:
QT_LOGGING_RULES - Value:
digikam*=true
- Name:
- Run DebugView, then launch digiKam.
 macOS Host
Run digiKam from the terminal to view debug traces:
export QT_LOGGING_RULES="digikam*=true"
/Applications/digiKam.org/digikam.app/Contents/MacOS/digikam
 Dealing with Crashes in digiKam
 Linux Host Using GDB
 Native Package
Ensure digiKam is compiled with debug symbols. Install the debug package if using a distribution package.
Launch digiKam with GDB:
gdb digikam
(gdb) catch throw
(gdb) run
If digiKam crashes or freezes, generate a backtrace:
(gdb) btCopy the backtrace and exit GDB:
(gdb) quitShare the crash report
 AppImage Bundle
Use the
-debugversion of the AppImageDownload the debug version of digiKam (available on digikam.org).
Make the file executable and extract the AppImage contents
Open a terminal and run:
chmod +x digikam-*-debug.appimage && ./digikam-*-debug.appimage --appimage-extractThis will create a
squashfs-rootdirectory.Run the extracted AppImage in debug mode
In the same terminal, execute:
./squashfs-root/AppRun debugdigiKam will start and wait 30 seconds for the debugger to attach.
Attach GDB to the process
Open a second terminal. Download and run as root the run_digikam_gdb.sh bash script available here:
wget https://invent.kde.org/graphics/digikam/-/raw/master/project/bundles/appimage/data/run_digikam_gdb.sh?ref_type=heads -O ./run_remote_gdb.sh
chmod +x ./run_remote_gdb.sh
sudo ./run_remote_gdb.sh
Enter your password and GDB will automatically connect to the running digiKam process.
If digiKam generate an exception
Continue the execution:
(gdb) cIf digiKam crashes or freezes
- In the terminal where GDB is running, generate a backtrace:
bt- Copy the output. GDB will exit automatically. GDB will also generate a full trace of the session in the file gdb.txt
Share the crash report
Note: See below the screencast captured under Linux about to initiate a remote debugging session with GDB using 2 terminals.
 Windows Host
 Using Visual Studio
- Use the
-debugversion of the digiKam Windows Installer. Download the debug version of digiKam (available on digikam.org). - Install Visual Studio Community.
- Attach the debugger to the running
digikam.exeprocess via Debug → Attach to Process. - Reproduce the crash and check the Stack View for the backtrace.
- Share the crash report

 Using QtCreator
- Use the
-debugversion of the digiKam Windows Installer. Download the debug version of digiKam (available on digikam.org). - Install QtCreator.
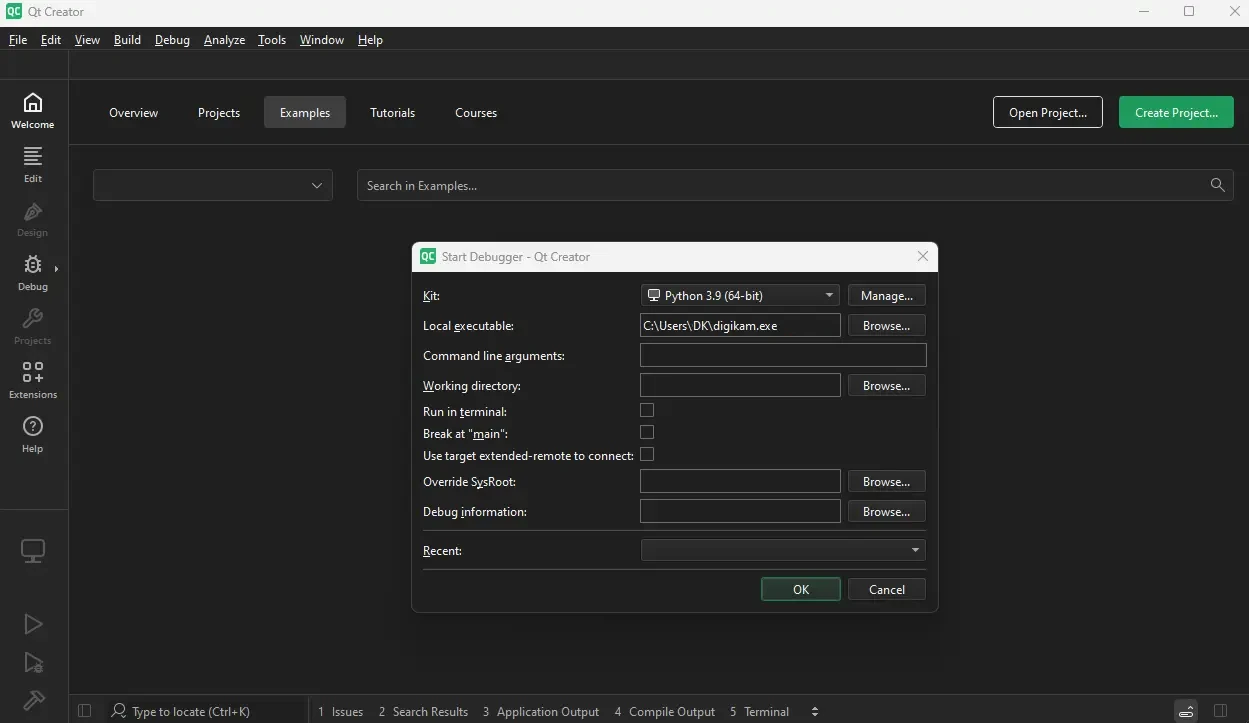
- Run digiKam in debug mode via Debug → Start Debugging → Start and Debug External Application.
- Enter the path to
digikam.exe(e.g.,C:\Program Files\digiKam\digikam.exe). - Reproduce the crash and check the Call Stack Trace for the backtrace.
- Share the crash report
 macOS Host
 Using The Terminal
- Use the
-debugversion of the digiKam macOS Package. Download the debug version of digiKam (available on digikam.org). - Install Xcode (includes
lldb). - Run digiKam in the debugger:
lldb /Applications/digiKam.org/digikam.app/Contents/MacOS/digikam (lldb) r - Reproduce the crash and generate a backtrace:
(lldb) bt - Share the crash report
 Using Xcode
- Use the
-debugversion of the digiKam macOS Package. Download the debug version of digiKam (available on digikam.org). - Install Xcode (includes
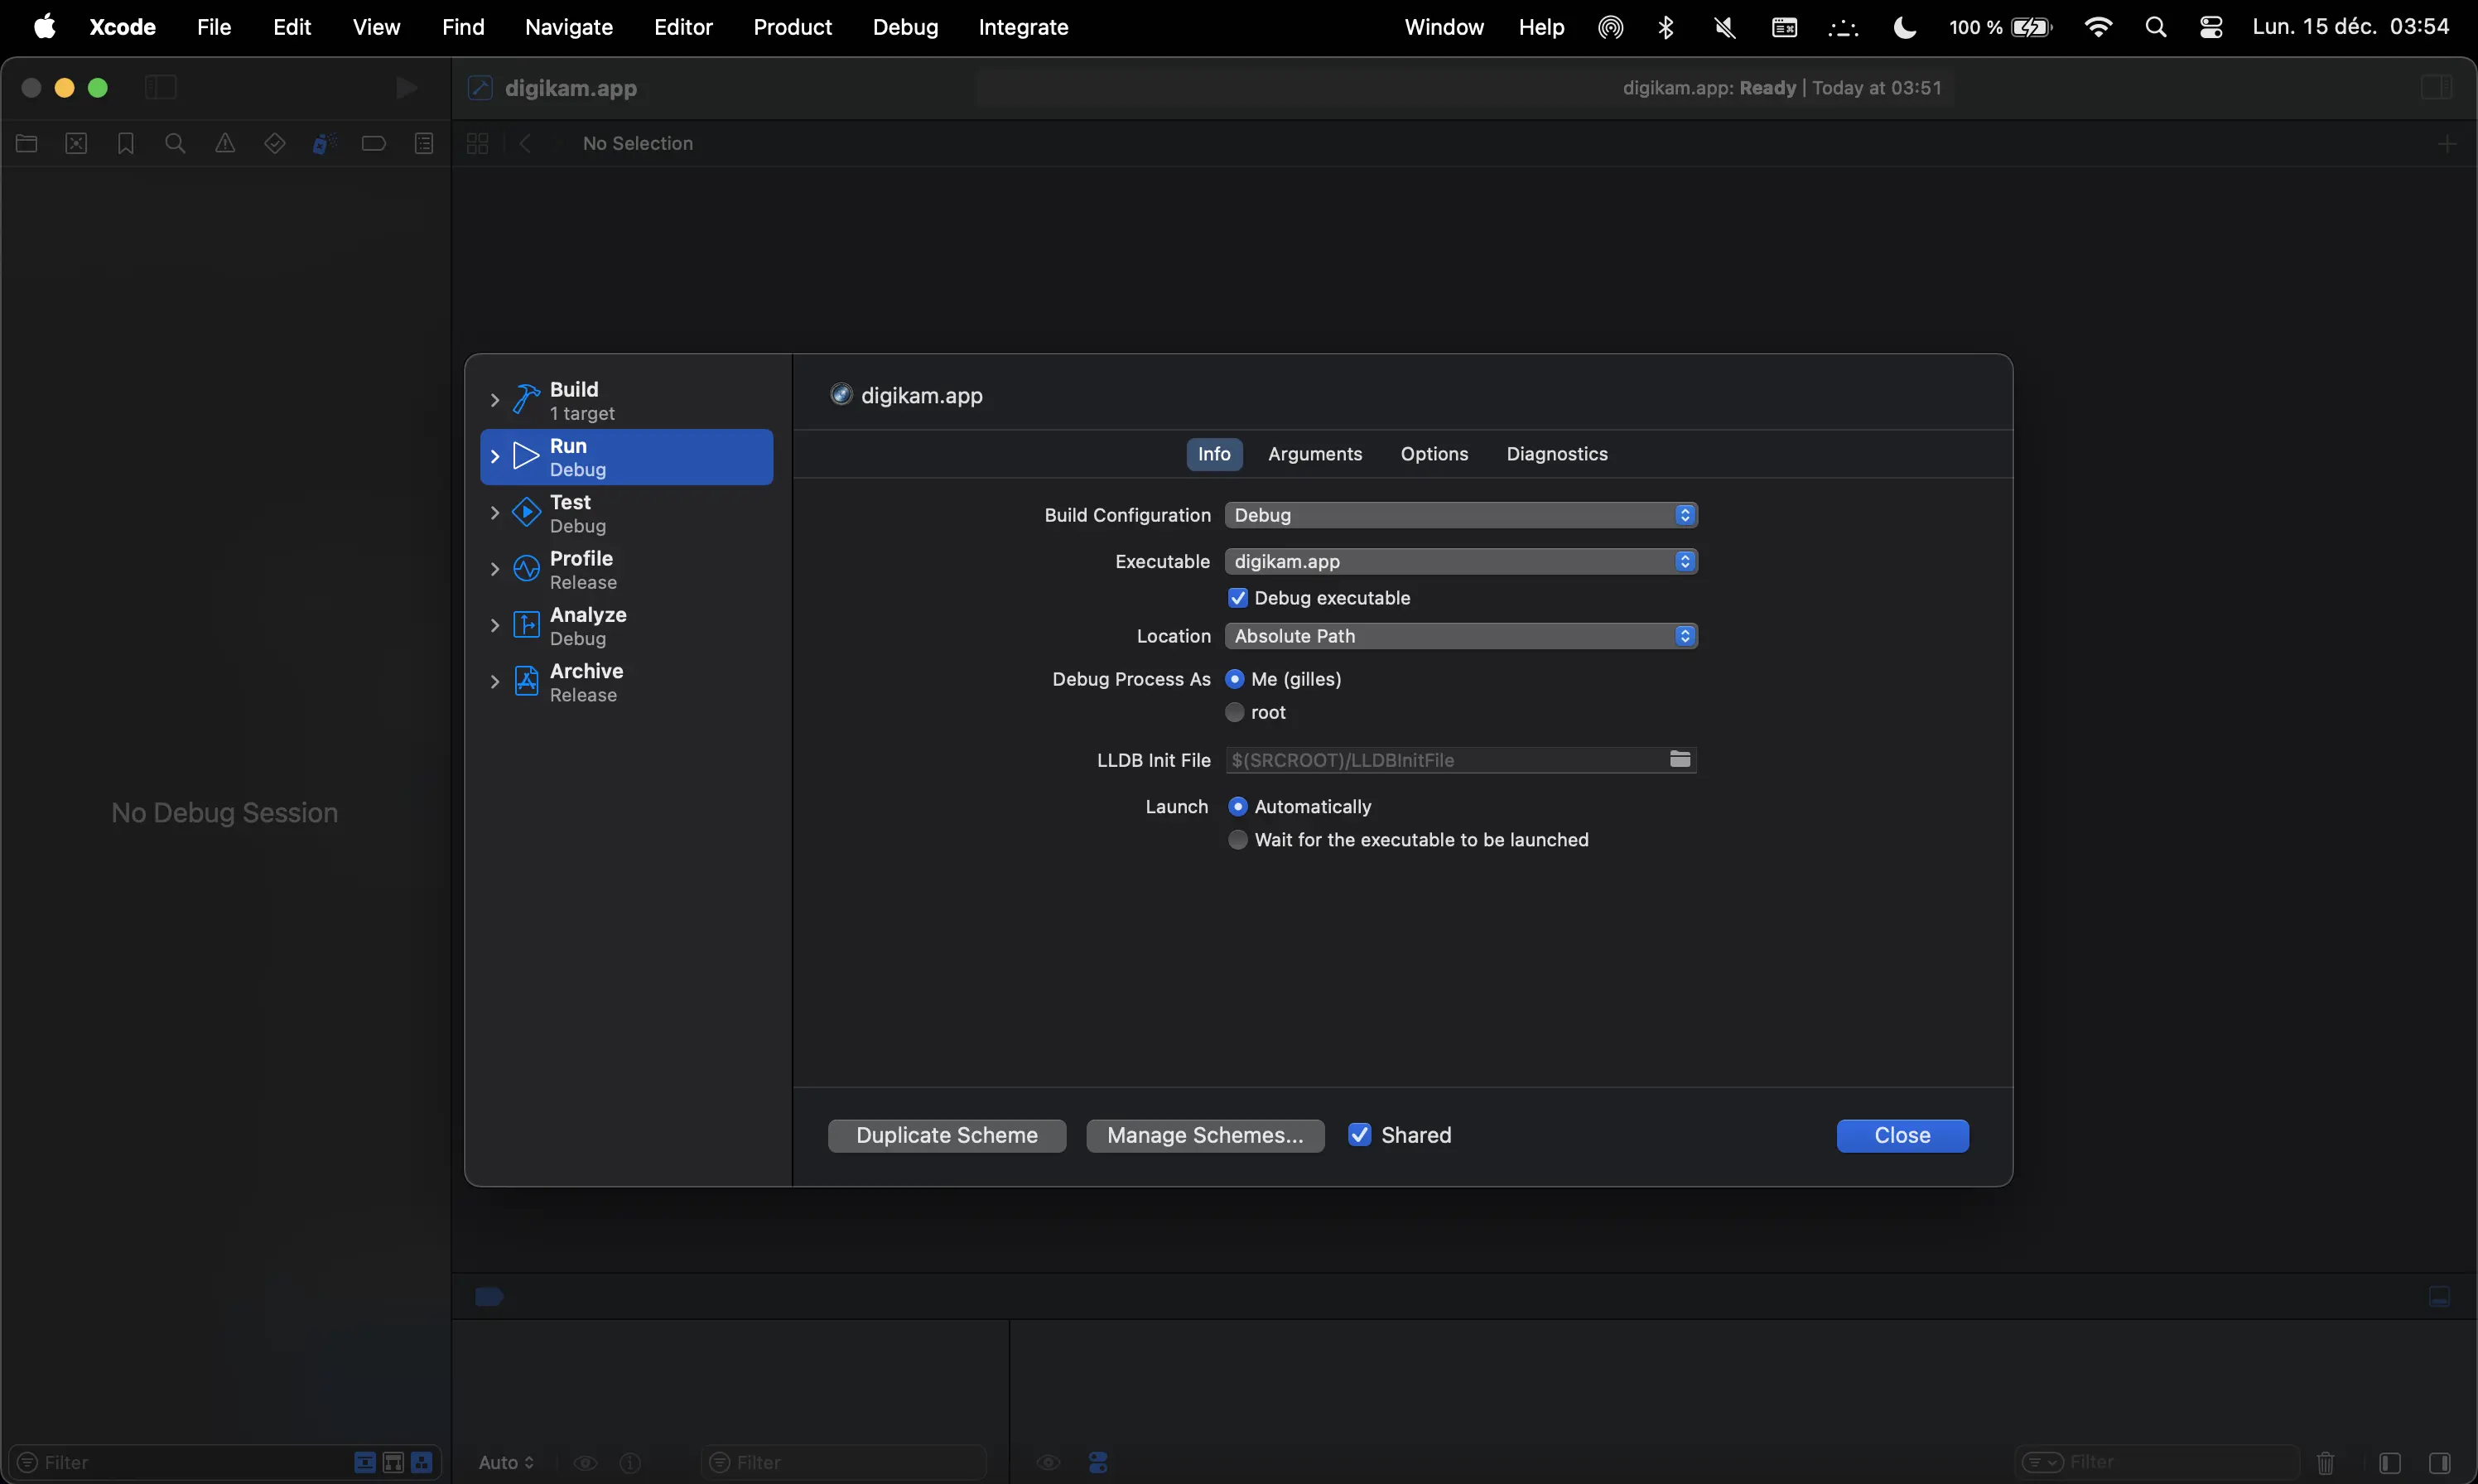
lldb). - Open a debugger session with digiKam Application via Debug → Debug Executable.
- Select the Application digiKam.org/digiKam.
- Attach the debugger to the running
digiKamprocess via Debug → Attach to Process. - Reproduce the crash and check the Call Stack Trace for the backtrace.
- Share the crash report
 Application Translations
To contribute to digiKam’s internationalization:
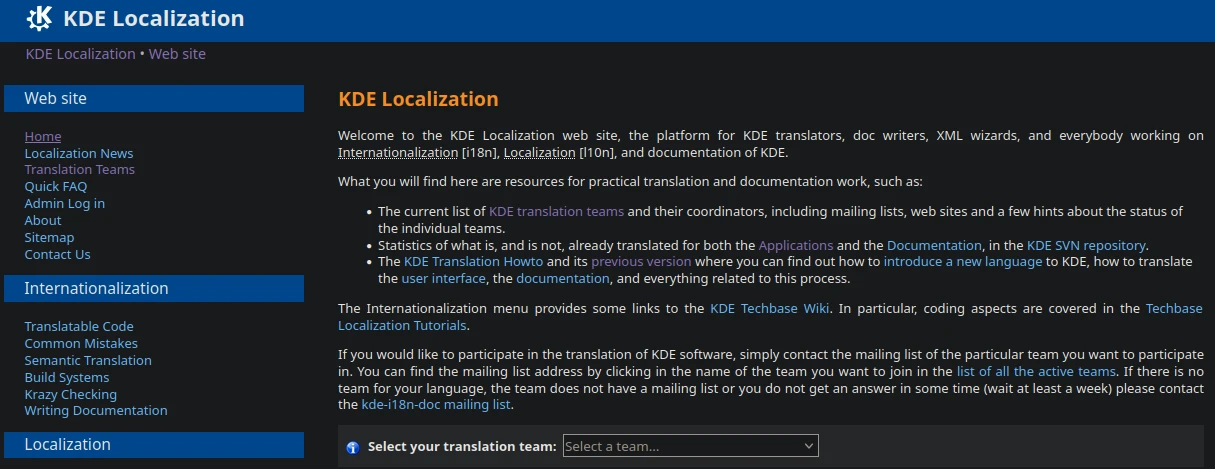
- Contact the KDE Translation Teams.
- Read the Translation HOWTO.
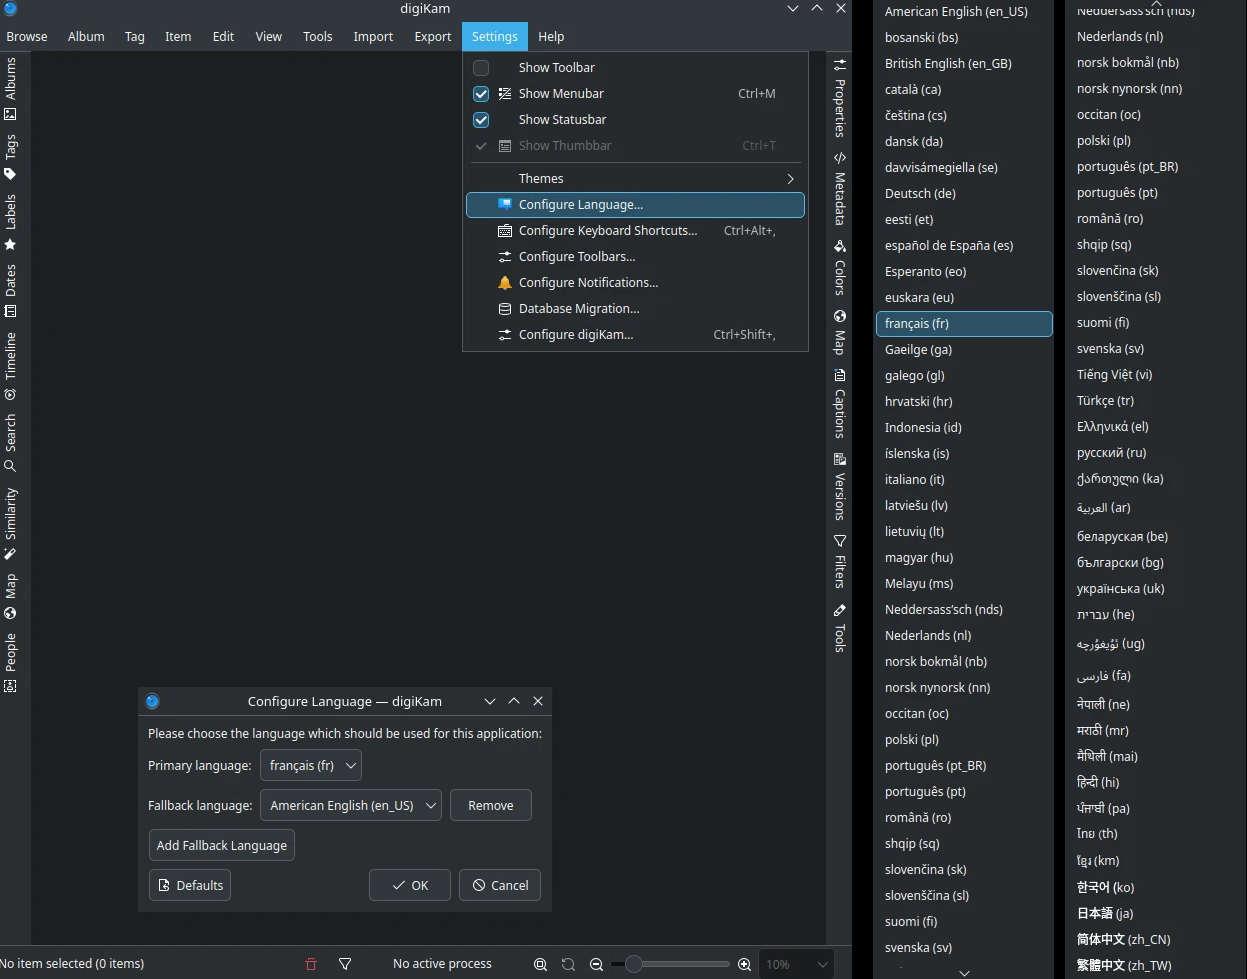
- Switch languages in digiKam via Settings → Configure Languages.
 Writing and Translating the Documentation
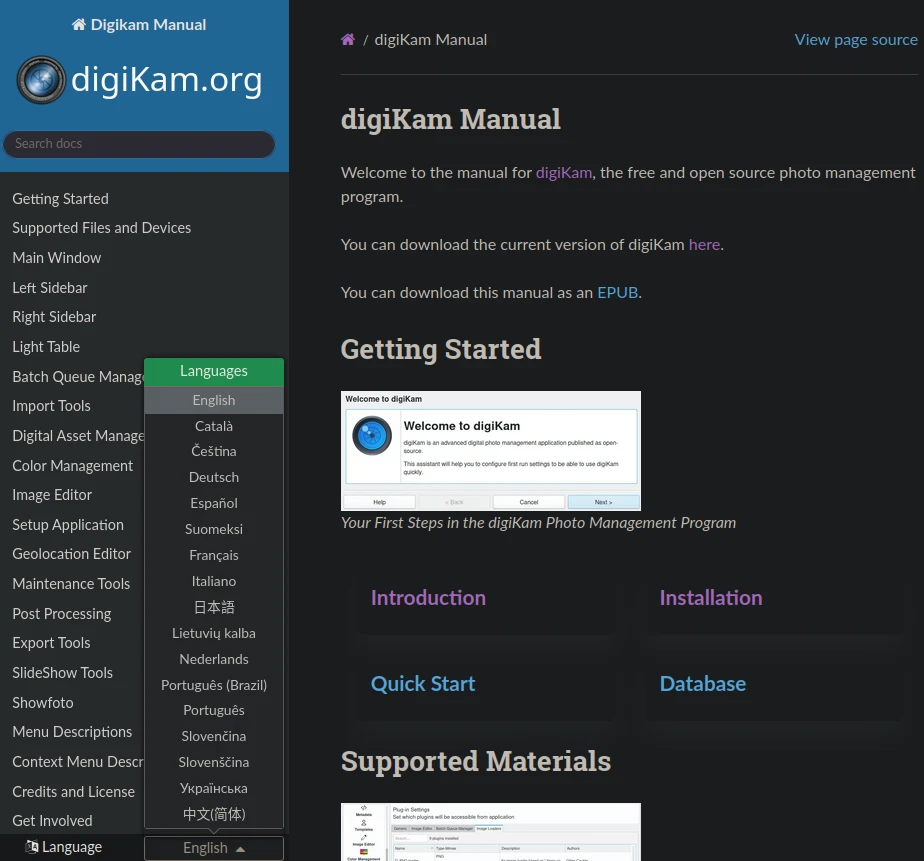
Help with writing or translating the documentation is always welcome. The documentation uses Sphinx and ReStructuredText. Source code is hosted in a dedicated Gitlab/KdeInvents repository and propose a complete guide for the new contributors. The documentation translation use the same workflow proposed with the Application translations.
 Picture Samples
We need RAW, TIFF, HEIF, and JPEG files from various manufacturers (Canon, Nikon, Sony, etc.) to improve metadata support. We also welcome sample files with IPTC/XMP metadata from other applications (e.g., Adobe Photoshop).
 Splash Screens and Background Photo
Photographers can submit their best photos for use as digiKam splash screens or welcome images. For details, visit this page.
